Neptune DXP API Tracing
Neptune DXP allows you to observe the execution of your APIs over a period of time through the API Trace function, logging errors, and recording performance metrics to test for latency. Each API defined in the API Designer can be enabled for tracing to capture execution data-points per API operation.
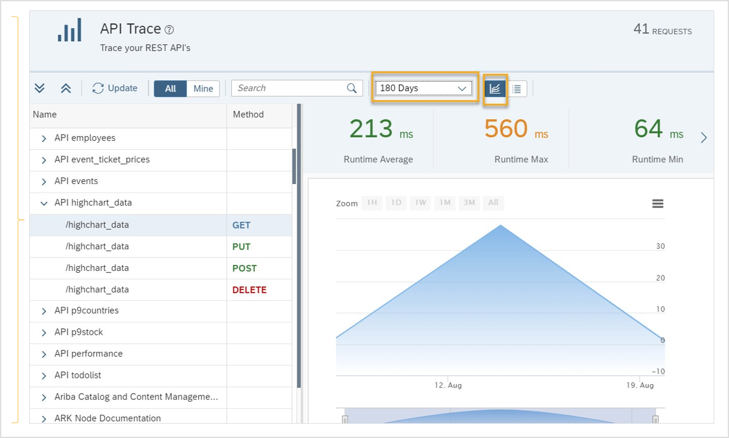
The collected trace data can be dynamically displayed as a time-series graph with variable granularity. The viewing time period can range from hourly to daily, weekly, monthly, quarterly or up to the maximum log retention period, providing aggregate metrics on the:
-
number of API requests
-
minimum API runtime, in milliseconds
-
average API runtime, in milliseconds
-
maximum API runtime, in milliseconds
-
successful API executions
-
erroneous API executions
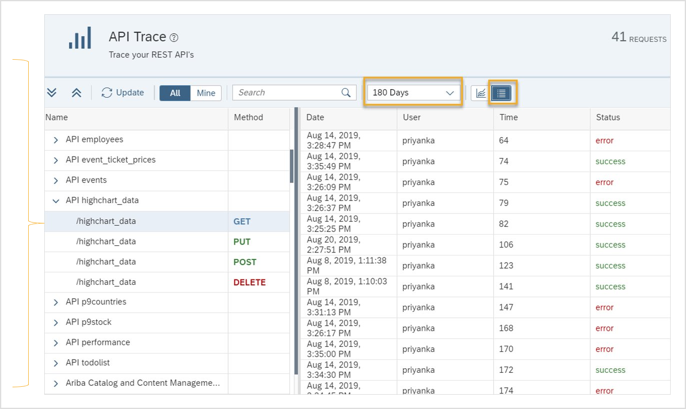
You can also inspect the individual API operations log metadata to diagnose connectivity, latency, or request/response formation issues. Neptune DXP facilitates this by ingesting API logs in real-time to present you with a comprehensive metrics list:
-
execution user
-
REST method e.g. GET, POST etc.
-
date and time of execution
-
Latency observed in milliseconds
-
Body Content response size
-
response success/failure status