Debug Android Mobile Client
such as an error condition that you had not coded for or maybe you are calling a Cordova plugin that has not been loaded or initialized. While the Launchpad Trace facility might provide some insight into why and what is happening, it is sometimes more handy to be able to debug the app as it runs on the device.
To be able to debug a Neptune Mobile Client installed on an Android phone, the mobile client must be built WITHOUT adding a certificate in PhoneGap!
Enable debug on Android
To debug an app on Android using Google Chrome you need to enable USB debugging for your Android device.
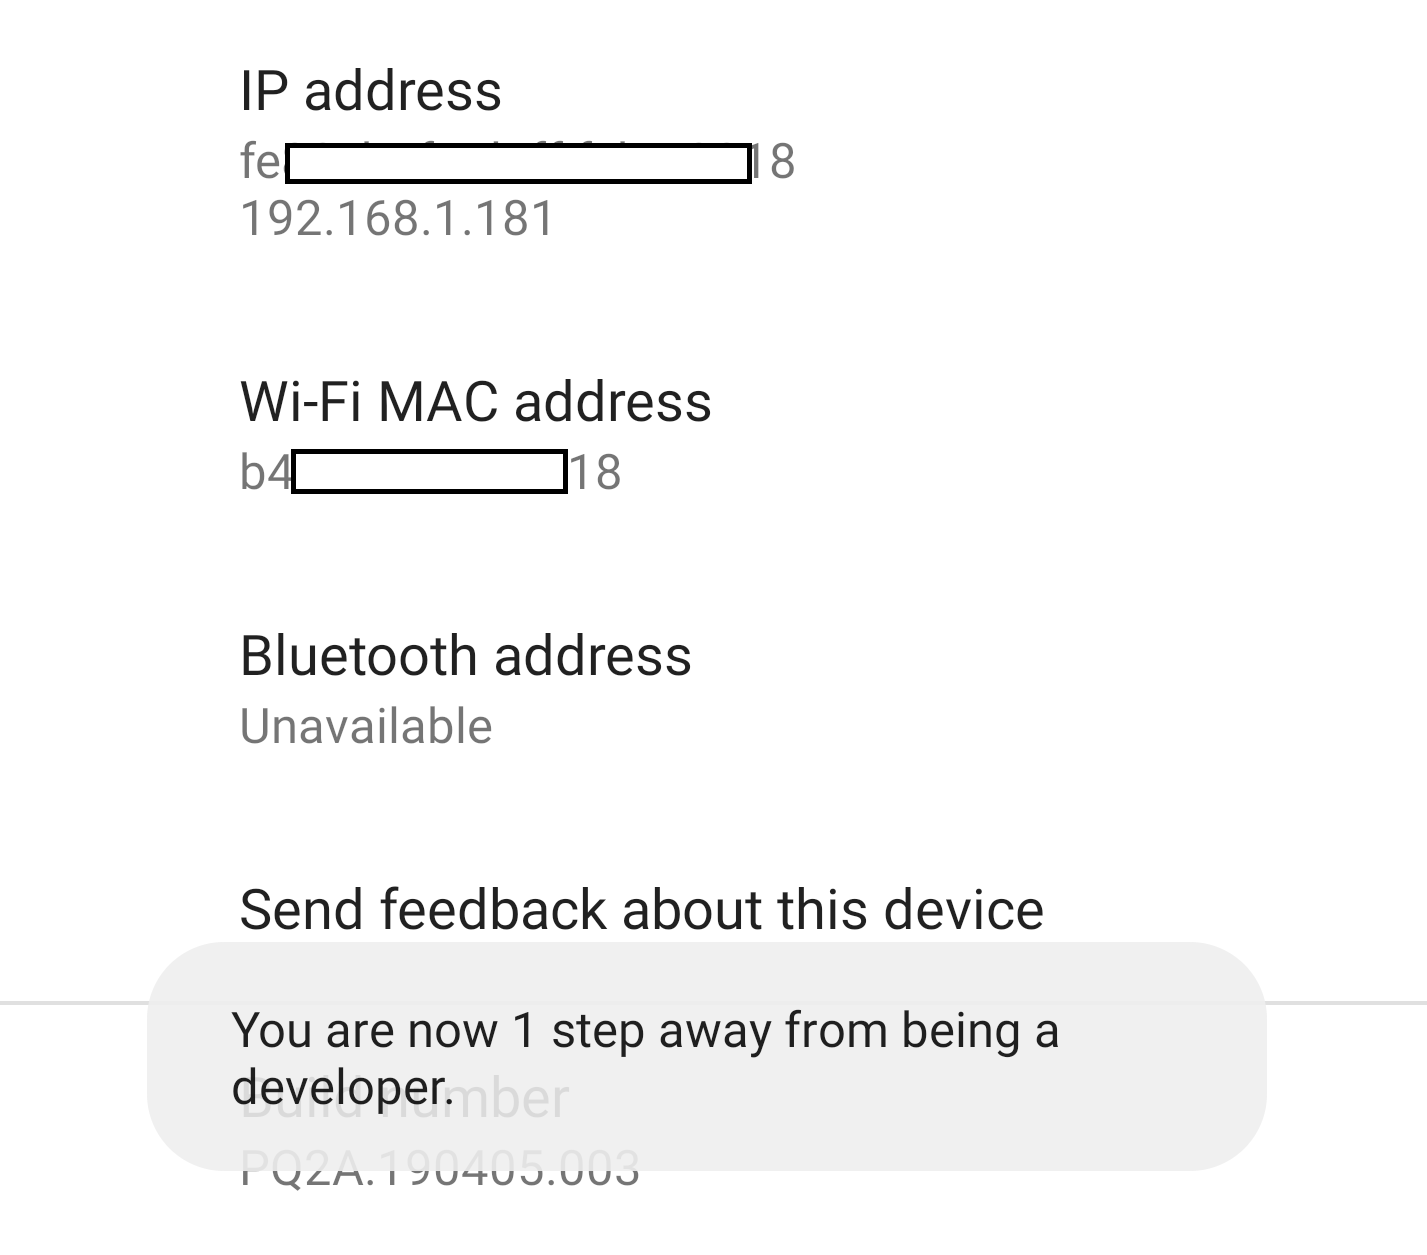
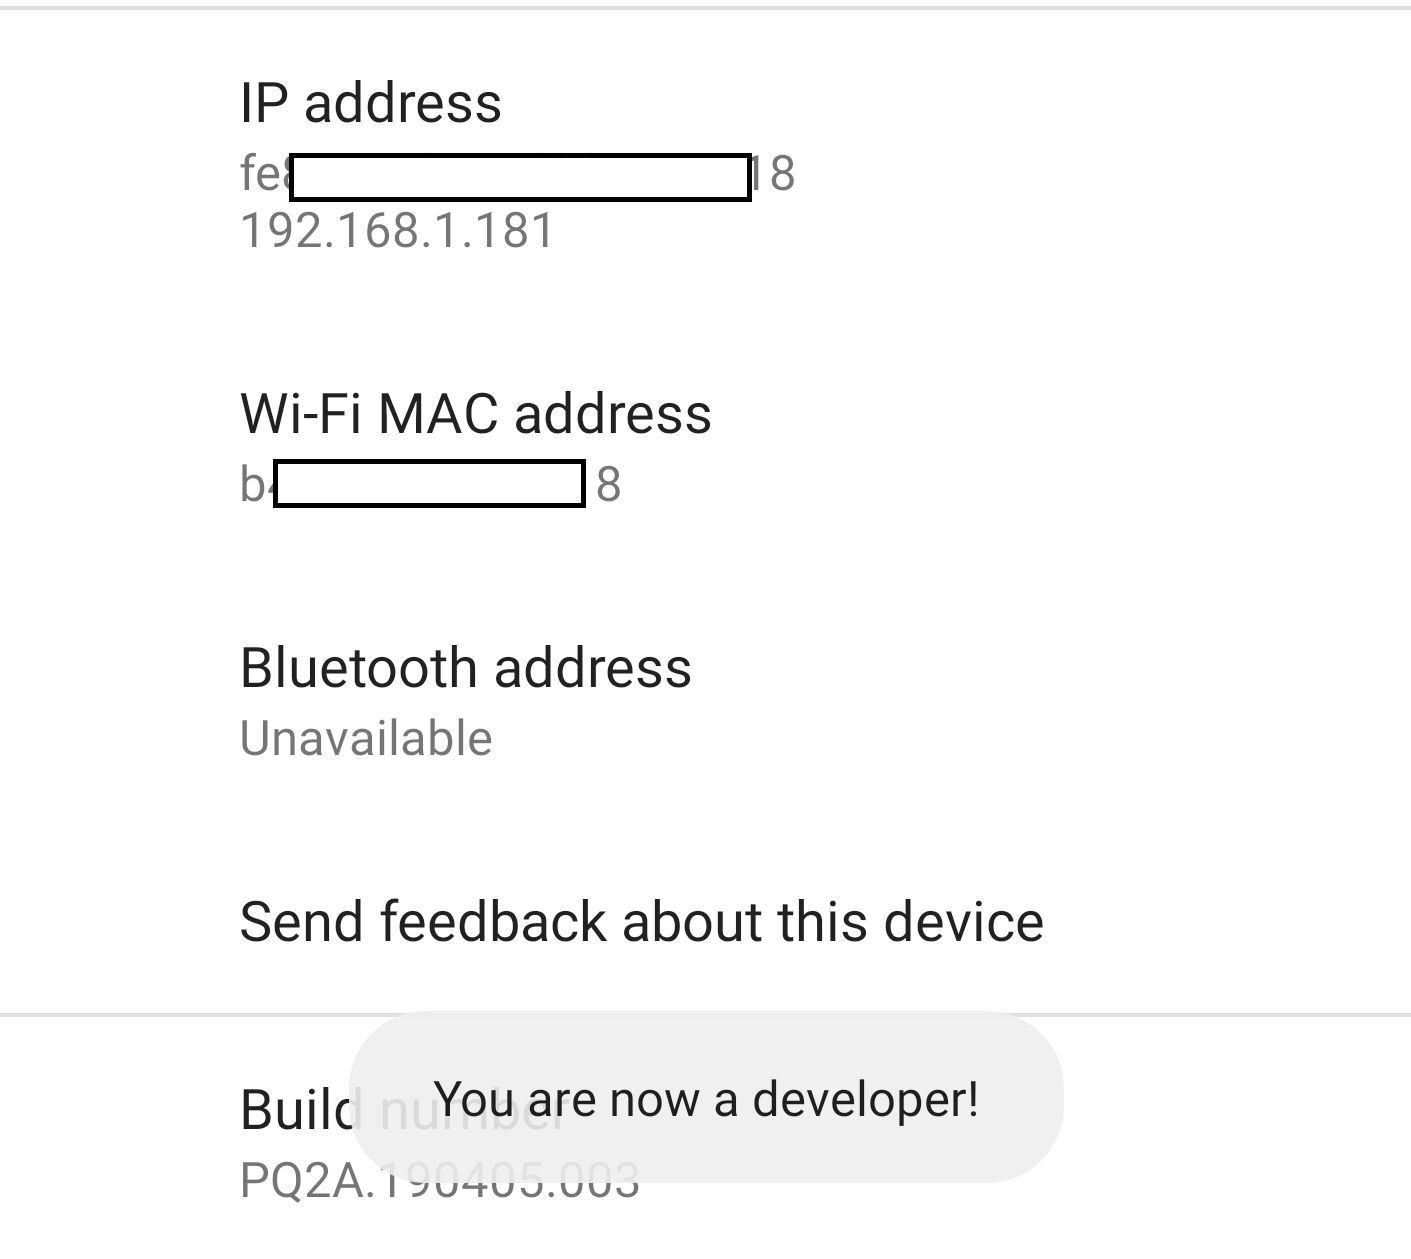
Go to About Phone and choose on the Build number _seven times till you see the "You are now a Developer" toast message to enable _Developer options for your device. Remember that depending on your device the Build number and Developer options menu might be at a different location.
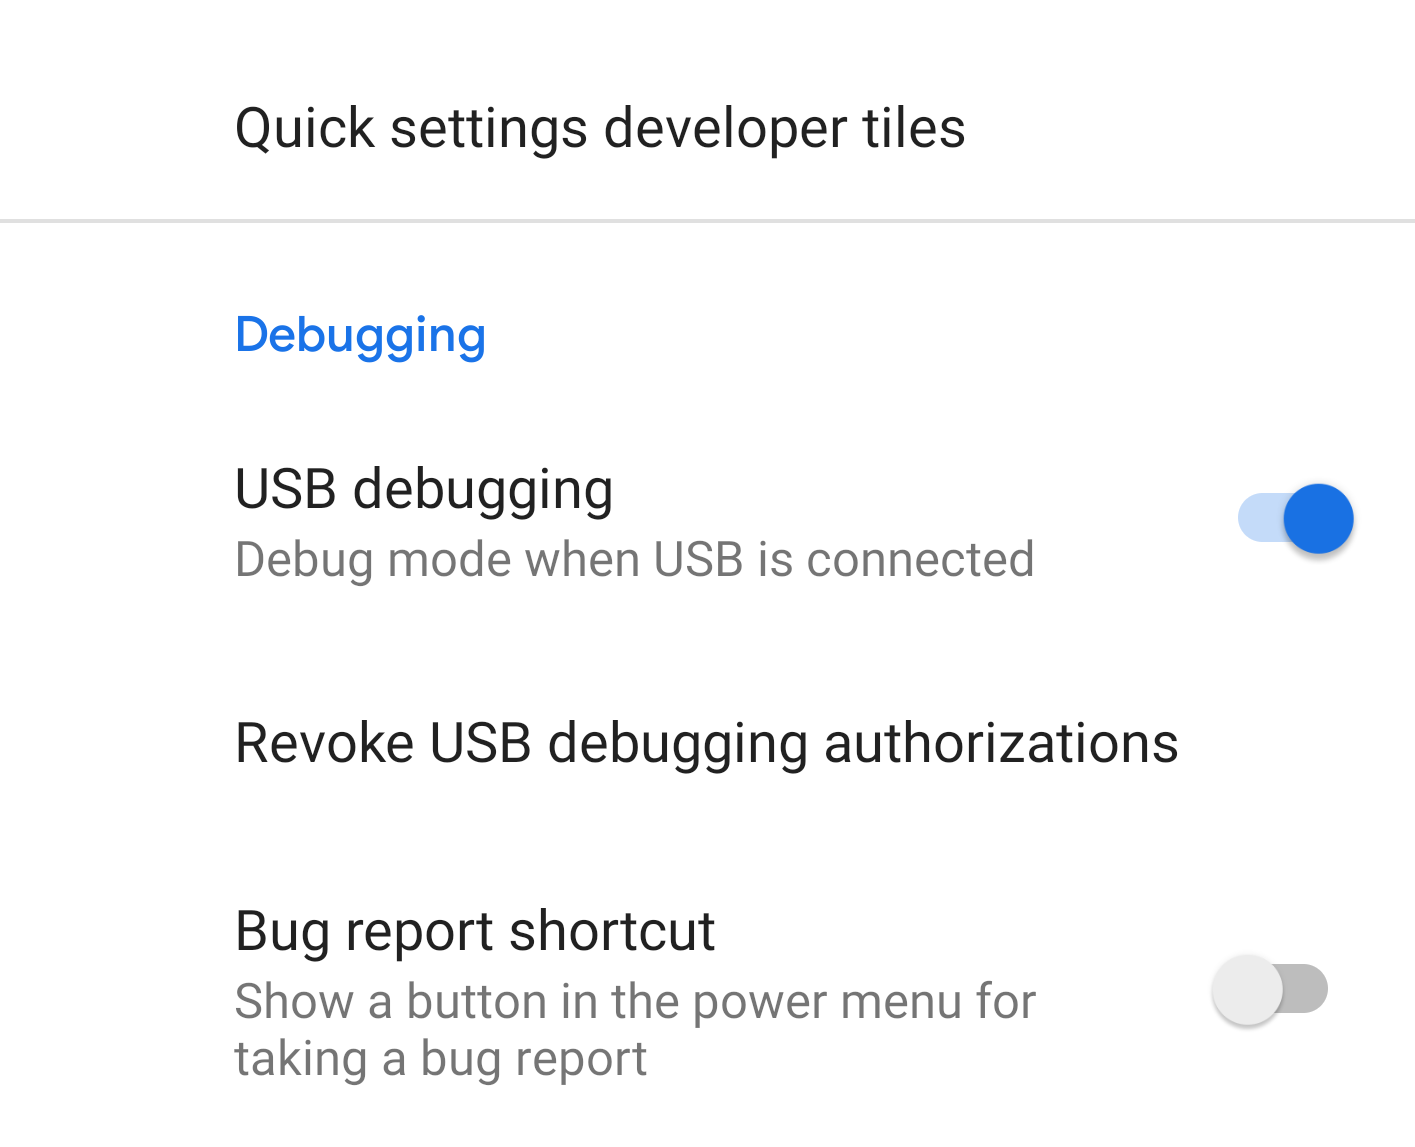
Go into Developer options _and enable _USB Debugging.
Install OEM USB Drivers
Download and install the OEM USB drivers for your device.
Install Android Debug Bridge (ADB)
You also need to download the Android Debug Bridge or ADB from here. You can also refer to this comprehensive blog from Lifehacker to install ADB on your platform of choice.
Connect phone and enable debugging
Connect your phone to your laptop/pc using a USB cable.
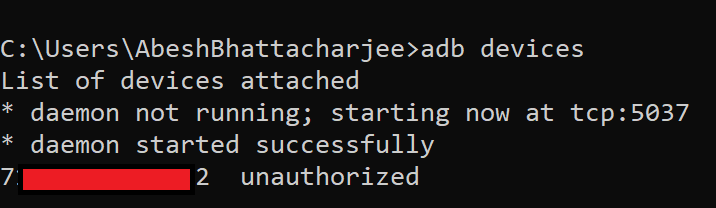
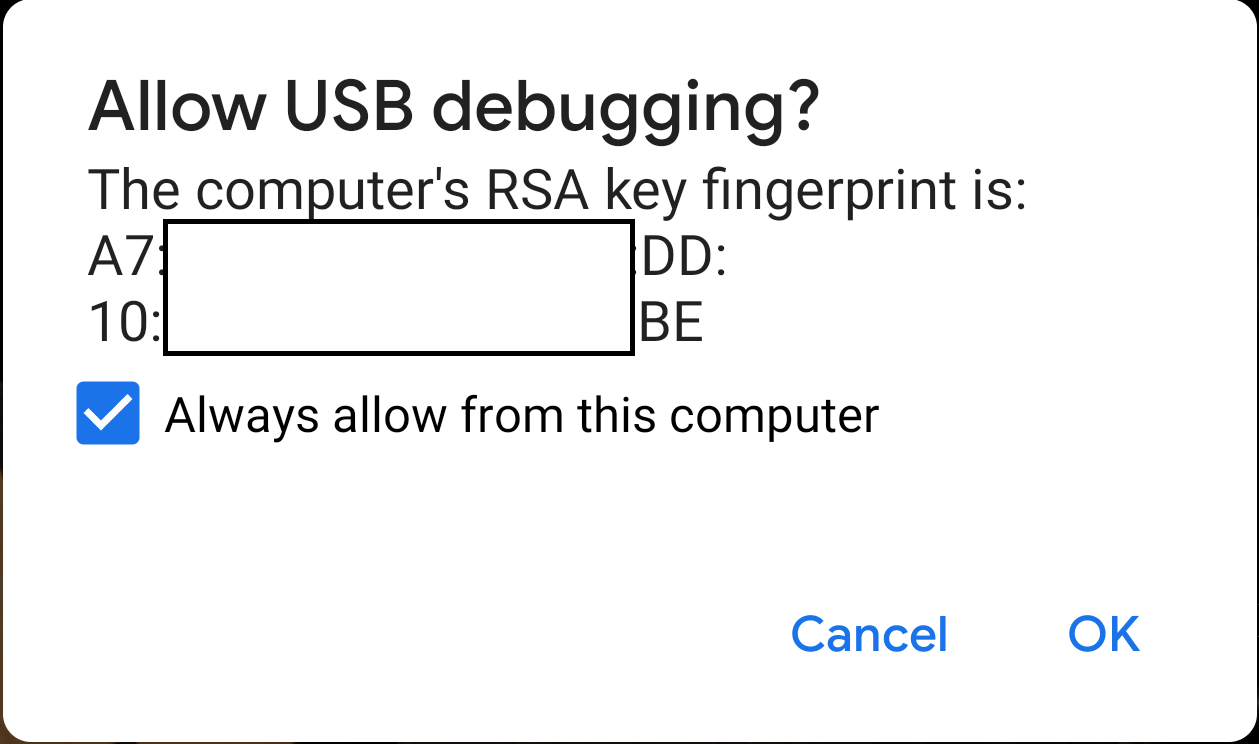
Open a command prompt and issue the command _adb devices. _The device will show up as unauthorized.
You should see a prompt asking you to enable USB debugging on your phone. Check the _Always allow from this computer _setting if you generally use the same pc to debug your applications.
Issue the _adb devices _command again and your device should no
longer show up as
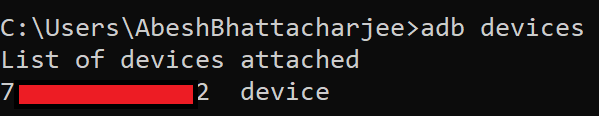
Remote debug in Google Chrome
Update March 2, 2022: In case you don’t find "Remote Devices" in the Chrome Developer tools, enter "chrome://inspect#devices " in the adress field (see https://developer.chrome.com/docs/devtools/remote-debugging/). Here you will find your device/webview when the device is properly connected.
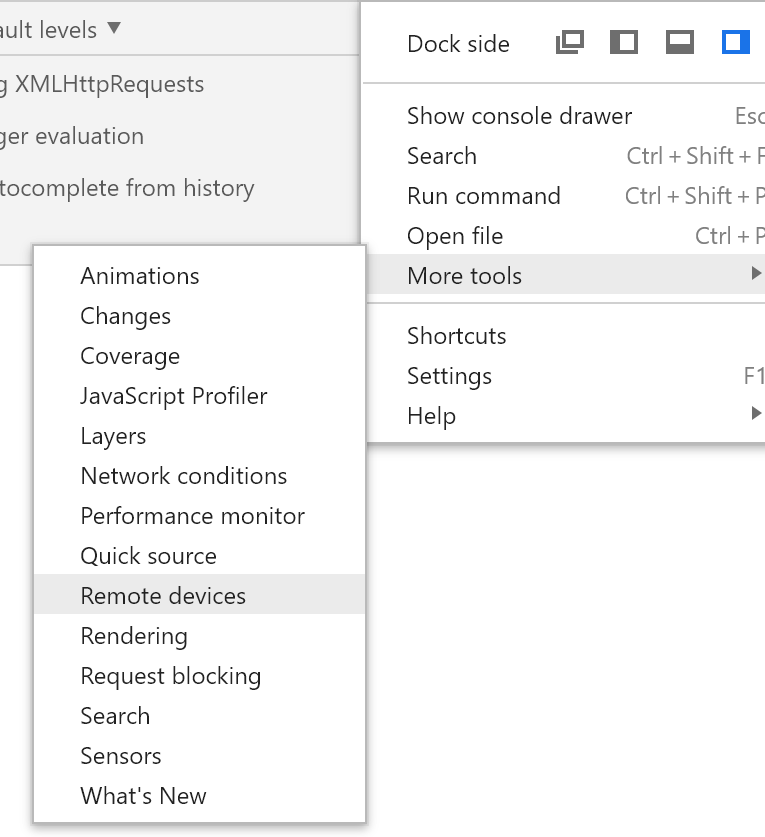
Now run your app on your mobile device and open Chrome Developer tools by pressing the F12 button.
On the top left menu of developer tools choose _"More tools → Remote
Devices" _and choose your device from the list in the bottom.
Now click on the _Inspect _button for the Webview for your app.
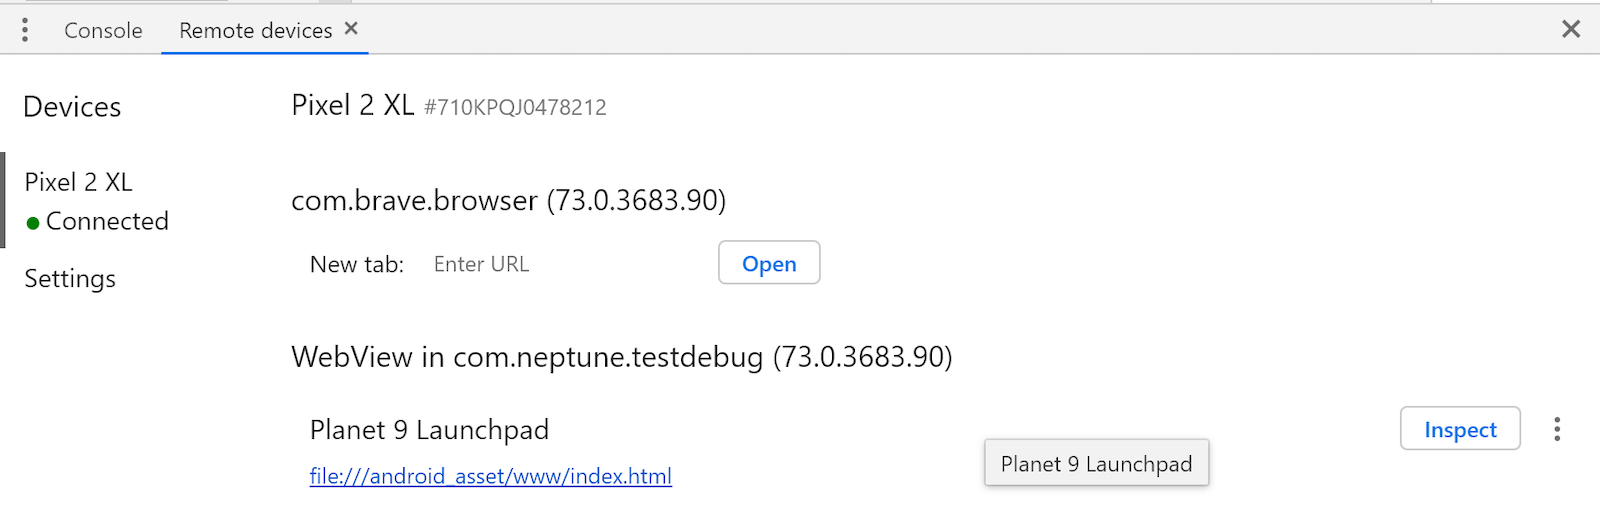
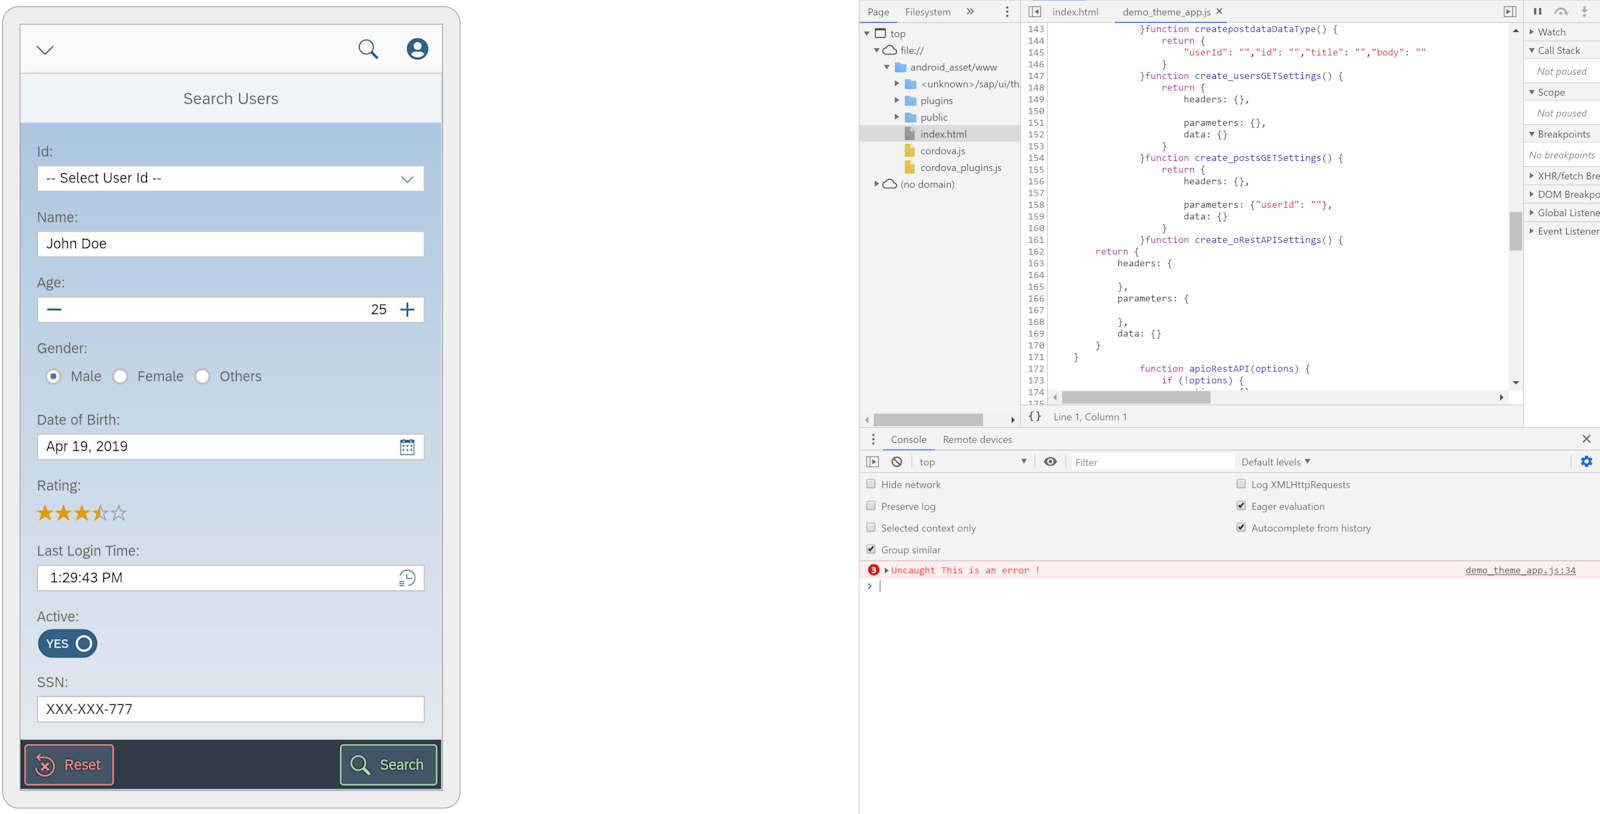
You should now have access to the source code of the app including any error message it throws. You should also be able to set breakpoints and make full use of Chrome’s debugging capabilities for your app.
I used the following line of code to simulate an unhandled error on the button click of an app.
throw "This is an error !";
This error shows up in the console on the button press.
That’s all folks ! Have fun debugging your apps !