Run Integration Cards and Highcharts in a Tile
In this section, you will discover how to configure a tile that can display either an Integration Card or a Highchart.
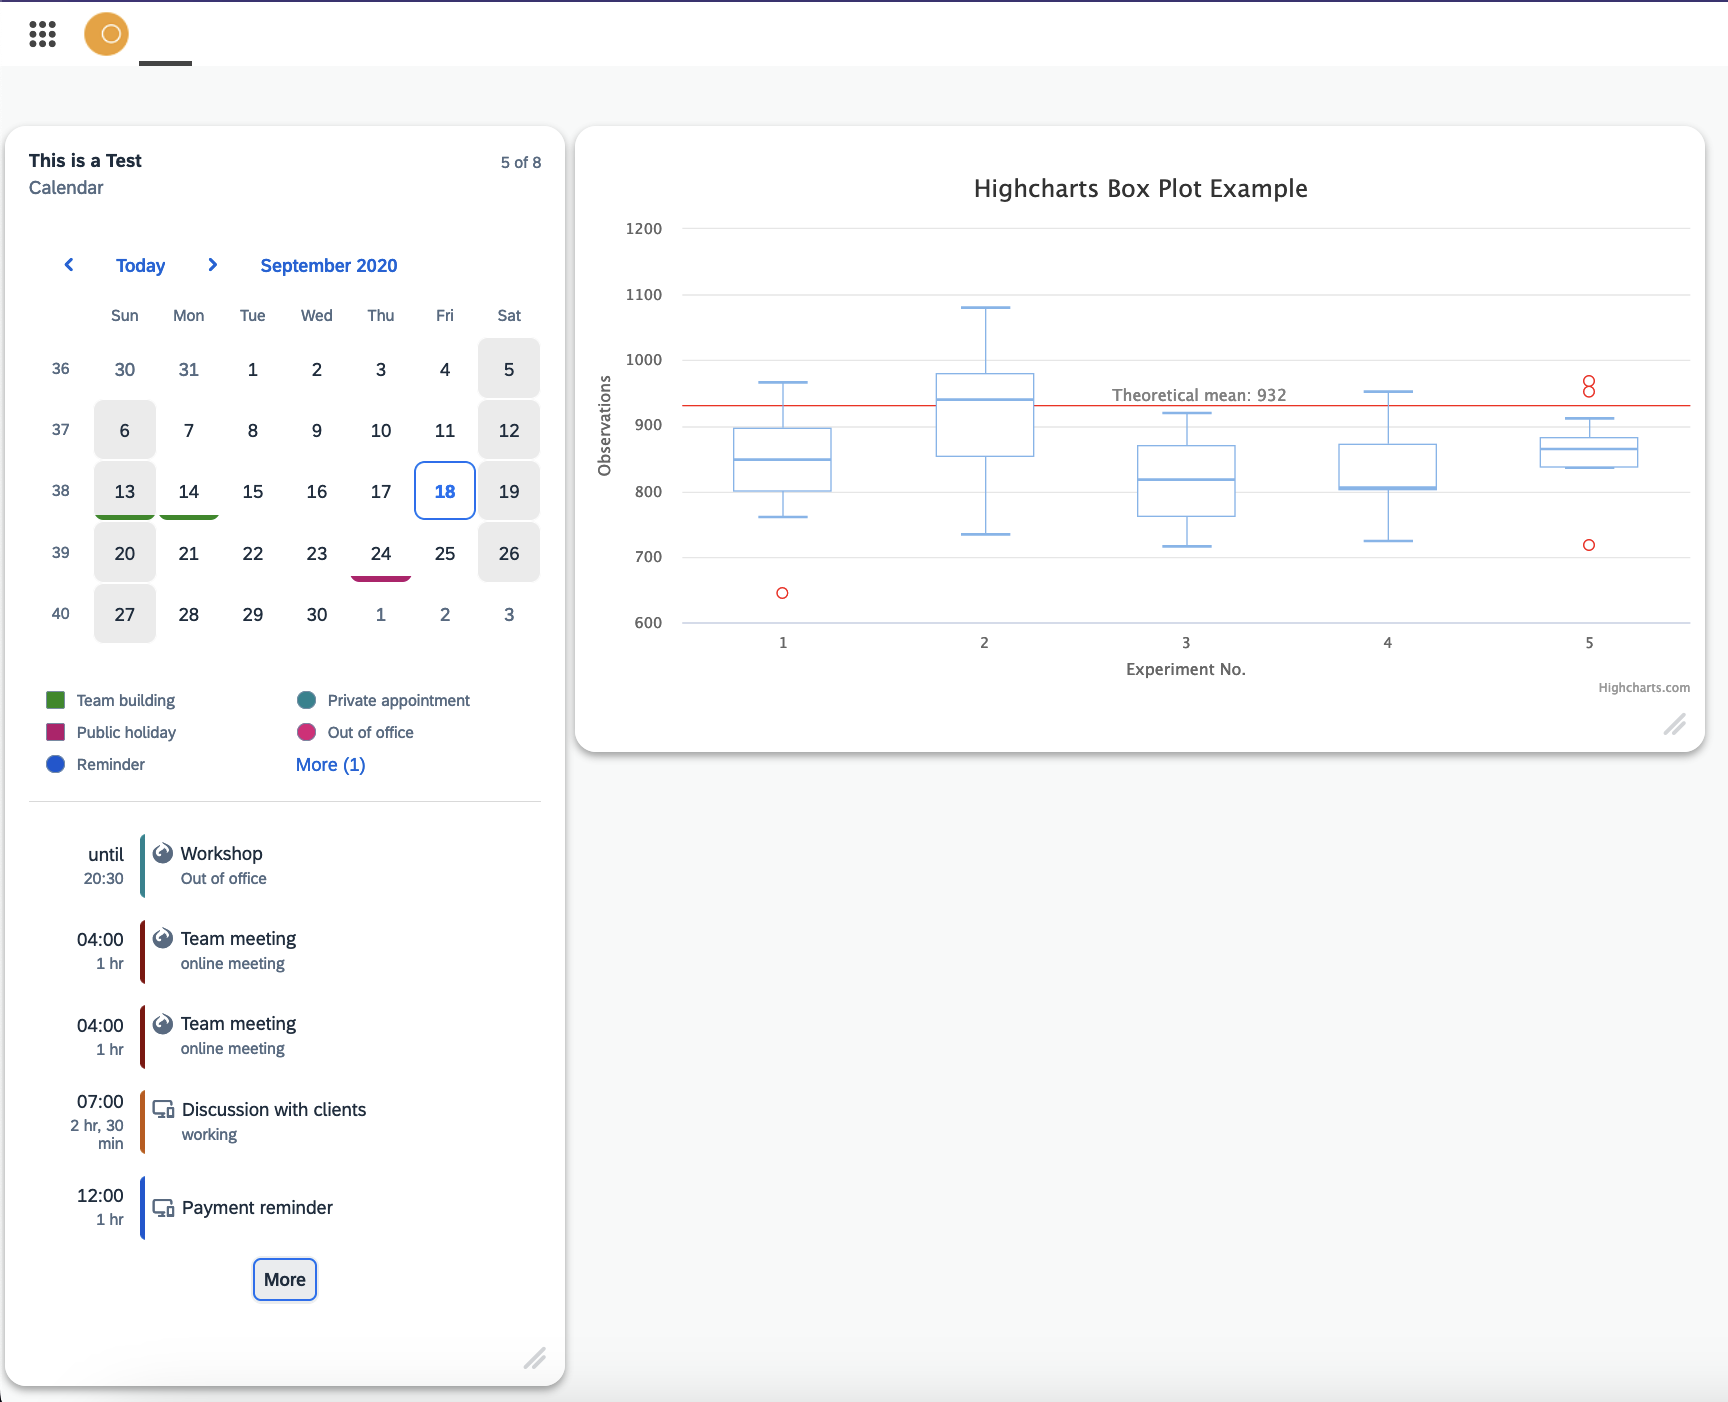
As a result, your launchpad will feature two tiles, one showcasing a Calendar Card and the other displaying a Box-Plot graph.
Prerequisites
-
A launchpad
-
A Tile Group has be defined in order to add the tile to the group.
-
A script
-
An API
Procedure
You will have to create two scripts containing the data and structure
Define the scripts
-
Create a new Project and add two new scripts:
-
IntCard
-
HighChart
-
Add the following in the IntCard script:
result.data = {  // our API response
  "_version": "1.14.0",
  "sap.app": {
	"id": "card.explorer.simple.calendar.card",
	"type": "card",
	"title": "Sample of a List with Highlight",
	"subTitle": "Sample of a Calendar with Highlight",
	"applicationVersion": {
	  "version": "1.0.0"
	},
	"shortTitle": "A short title for this Card",
	"info": "Additional information about this Card",
	"description": "A long description for this Card",
	"tags": {
	  "keywords": [
		"Calendar",
		"Highlight",
		"Card",
		"Sample"
	  ]
	}
  },
  "sap.card": {
	"type": "Calendar",
	"data": {
	  "json": {
		"item": [
		  {
			"start": "2020-09-18T09:00",
			"end": "2020-09-18T10:00",
			"title": "Payment reminder",
			"icon": "sap-icon://desktop-mobile",
			"type": "Type06",
			"url": "http://sap.com"
		  },
		  {
			"start": "2020-09-18T17:00",
			"end": "2020-09-18T17:30",
			"title": "Private appointment",
			"icon": "sap-icon://desktop-mobile",
			"type": "Type07"
		  },
		  {
			"start": "2020-09-18T12:00",
			"end": "2020-09-18T13:00",
			"title": "Lunch",
			"text": "working",
			"icon": "sap-icon://desktop-mobile",
			"type": "Type03",
			"url": "http://sap.com"
		  },
		  {
			"start": "2020-09-16T08:30",
			"end": "2020-09-18T17:30",
			"title": "Workshop",
			"text": "Out of office",
			"icon": "sap-icon://sap-ui5",
			"type": "Type07"
		  },
		  {
			"start": "2020-09-18T14:00",
			"end": "2020-09-18T16:30",
			"title": "Discussion with clients",
			"text": "working",
			"icon": "sap-icon://desktop-mobile",
			"url": "http://sap.com"
		  },
		  {
			"start": "2020-09-18T01:00",
			"end": "2020-09-18T02:00",
			"title": "Team meeting",
			"text": "online meeting",
			"icon": "sap-icon://sap-ui5",
			"type": "Type04"
		  },
		  {
			"start": "2020-09-18T04:00",
			"end": "2020-09-18T06:30",
			"title": "Discussion with clients",
			"text": "working",
			"icon": "sap-icon://desktop-mobile",
			"url": "http://sap.com"
		  },
		  {
			"start": "2020-09-18T01:00",
			"end": "2020-09-18T02:00",
			"title": "Team meeting",
			"text": "online meeting",
			"icon": "sap-icon://sap-ui5",
			"type": "Type04"
		  }
		],
		"specialDate": [
		  {
			"start": "2020-09-13",
			"end": "2020-09-14",
			"type": "Type08"
		  },
		  {
			"start": "2020-09-24",
			"end": "2020-09-24",
			"type": "Type13"
		  }
		],
		"legendItem": [
		  {
			"category": "calendar",
			"text": "Team building",
			"type": "Type08"
		  },
		  {
			"category": "calendar",
			"text": "Public holiday",
			"type": "Type13"
		  },
		  {
			"category": "appointment",
			"text": "Reminder",
			"type": "Type06"
		  },
		  {
			"category": "appointment",
			"text": "Private appointment",
			"type": "Type07"
		  },
		  {
			"category": "appointment",
			"text": "Out of office",
			"type": "Type03"
		  },
		  {
			"category": "appointment",
			"text": "Collaboration with other team members",
			"type": "Type07"
		  }
		]
	  }
	},
	"header": {
	  "title": "Mpastarde Pitta se gamaw",
	  "subTitle": "Kai tin mounara tin froso",
	  "status": {
		"text":  {
		  "format": {
			"translationKey": "i18n>CARD.COUNT_X_OF_Y",
			"parts": [
			  "parameters>/visibleItems",
			  "parameters>/allItems"
			]
		  }
		}
	  }
	},
	"content": {
	  "date": "2020-09-18",
	  "maxItems": 5,
	  "maxLegendItems": 5,
	  "noItemsText": "You have nothing planned for this day",
	  "item": {
		"template": {
		  "startDate": "{start}",
		  "endDate": "{end}",
		  "title": "{title}",
		  "text": "{text}",
		  "icon": {
			"src": "{icon}",
			"visible": true
		  },
		  "type": "{type}",
		  "actions": [
			{
			  "type": "Navigation",
			  "enabled": "{= ${url}}",
			  "parameters": {
				"url": "{url}"
			  }
			}
		  ]
		},
		"path": "/item"
	  },
	  "specialDate": {
		"template": {
		  "startDate": "{start}",
		  "endDate": "{end}",
		  "type": "{type}"
		},
		"path": "/specialDate"
	  },
	  "legendItem": {
		"template": {
		  "category": "{category}",
		  "text": "{text}",
		  "type": "{type}"
		},
		"path": "/legendItem"
	  },
	  "moreItems": {
		"actions": [
		  {
			"type": "Navigation",
			"enabled": true,
			"parameters": {
				"url": "http://sap.com"
			}
		  }
		]
	  }
	}
  }
}
and in the HighChart script:
result.data = {  // our API response

    chart: {
        type: 'boxplot'
    },

    title: {
        text: 'Highcharts Box Plot Example'
    },

    legend: {
        enabled: false
    },

    xAxis: {
        categories: ['1', '2', '3', '4', '5'],
        title: {
            text: 'Experiment No.'
        }
    },

    yAxis: {
        title: {
            text: 'Observations'
        },
        plotLines: [{
            value: 932,
            color: 'red',
            width: 1,
            label: {
                text: 'Theoretical mean: 932',
                align: 'center',
                style: {
                    color: 'gray'
                }
            }
        }]
    },

    series: [{
        name: 'Observations',
        data: [
            [760, 801, 848, 895, 965],
            [733, 853, 939, 980, 1080],
            [714, 762, 817, 870, 918],
            [724, 802, 806, 871, 950],
            [834, 836, 864, 882, 910]
        ],
        tooltip: {
            headerFormat: '<em>Experiment No {point.key}</em><br/>'
        }
    }, {
        name: 'Outliers',
        color: "blue",
        type: 'scatter',
        data: [ // x, y positions where 0 is the first category
            [0, 644],
            [4, 718],
            [4, 951],
            [4, 969]
        ],
        marker: {
            fillColor: 'white',
            lineWidth: 1,
            lineColor: "red"
        },
        tooltip: {
            pointFormat: 'Observation: {point.y}'
        }
    }]

}
For more Integration Card examples visit the SAP Card Explorer and for Highcharts visit the Highchart Demos Page.
Define the API
-
Define an API in the API Designer and set the type as Server Script
-
In the API, create two definitions , set the Method as GET and set the Path as:
-
/highchart -
/intcard
-
-
Next to the Path click on the URL Button and copy the URL path from a full URL. For example:
/api/serverscript/tilecards/intcard
Copy the path for both definitions. They will be used for defining our tiles.
Define the two Tiles
Now that our scripts and APIs are set, all we have to do is to define the two tiles and add them in a tile group.
-
Create two tiles, give meaningful names and set the type as Integration Card and Highchart accordingly
-
Paste the previously copied path into the Data URL for each tile